Building a typology of the transitions from school to work
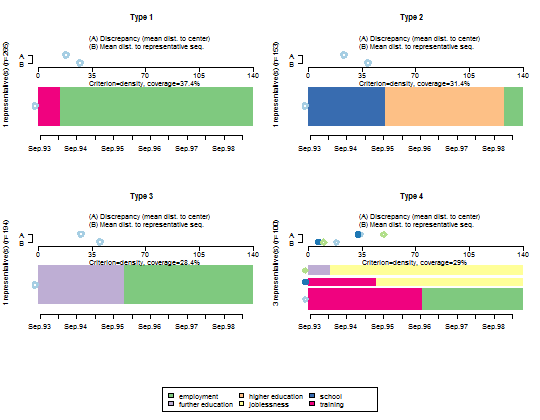
Building a typology and visualizing the results is very simple with TraMineR and R. The following figure displays the representative sequences (
Gabadinho and Ritschard, 2013) of each of the four types of transition identified by clustering the sequences from the pairwise distance matrix. Commands to build the typology and alternative ways of rendering the clusters are provided
below the first figure.

- Create a state sequence object from the mvad data set.
-
Compute the optimal matching distances using substitution costs based on transition rates observed in the data and a 1 indel cost. The resulting distance matrix is stored in the dist.om1 object.
dist.om1 <- seqdist(mvad.seq, method = "OM", indel = 1, sm = "TRATE")
-
Make a typology of the trajectories: load the cluster
library, build a Ward hierarchical clustering of the sequences from the optimal matching distances and retrieve for each individual sequence the cluster membership of the 4 class solution. We do not show here the dendrogram produced by plot(clusterward1), which, indeed, is not a TraMineR feature.
library(cluster)
clusterward1 <- agnes(dist.om1, diss = TRUE, method = "ward")
plot(clusterward1, which.plot = 2)
cl1.4 <- cutree(clusterward1, k = 4)
cl1.4fac <- factor(cl1.4, labels = paste("Type", 1:4))
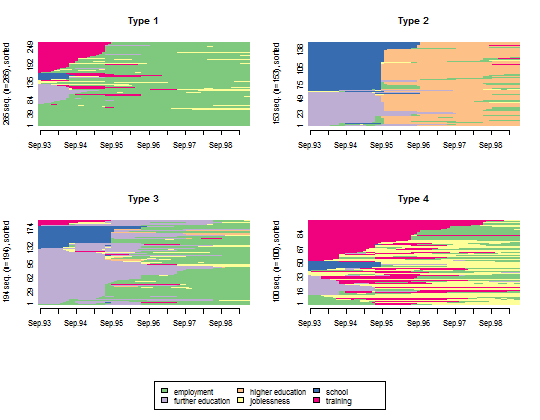
- Plot all the sequences within each cluster.
seqIplot(mvad.seq, group = cl1.4fac, sortv = "from.start")

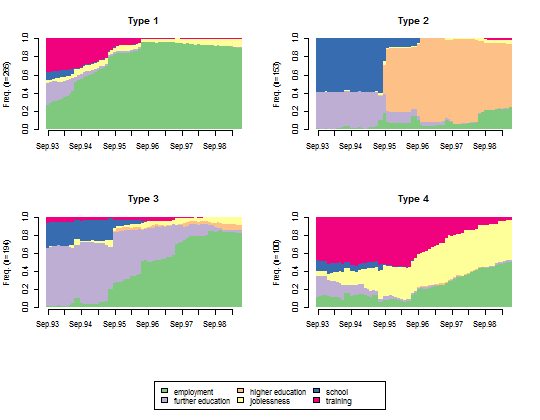
- Plot the state distribution within each cluster.
seqdplot(mvad.seq, group = cl1.4fac, border = NA)

- Plot the representative sequences of each cluster.
seqrplot(mvad.seq, diss = dist.om1, group = cl1.4fac,
    border = NA)

--------------
Gabadinho, A. & Ritschard, G. (2013), "Searching for typical life trajectories applied to childbirth histories", In Levy, R. & Widmer, E. (eds) Gendered life courses - Between individualization and standardization. A European approach applied to Switzerland, pp. 287-312. Vienna: LIT.
Available here.


